

Continuously monitor the availability and response time of your websites from various locations.
Track website performance metrics such as page load time, server response time, and resource utilization.
Monitor for HTTP errors, broken links, and other issues affecting the user experience.
Implement web application firewalls (WAFs) and perform regular security scans to detect vulnerabilities and malware.

We offer you the cloud scope to monitor for all the instance at the same time.
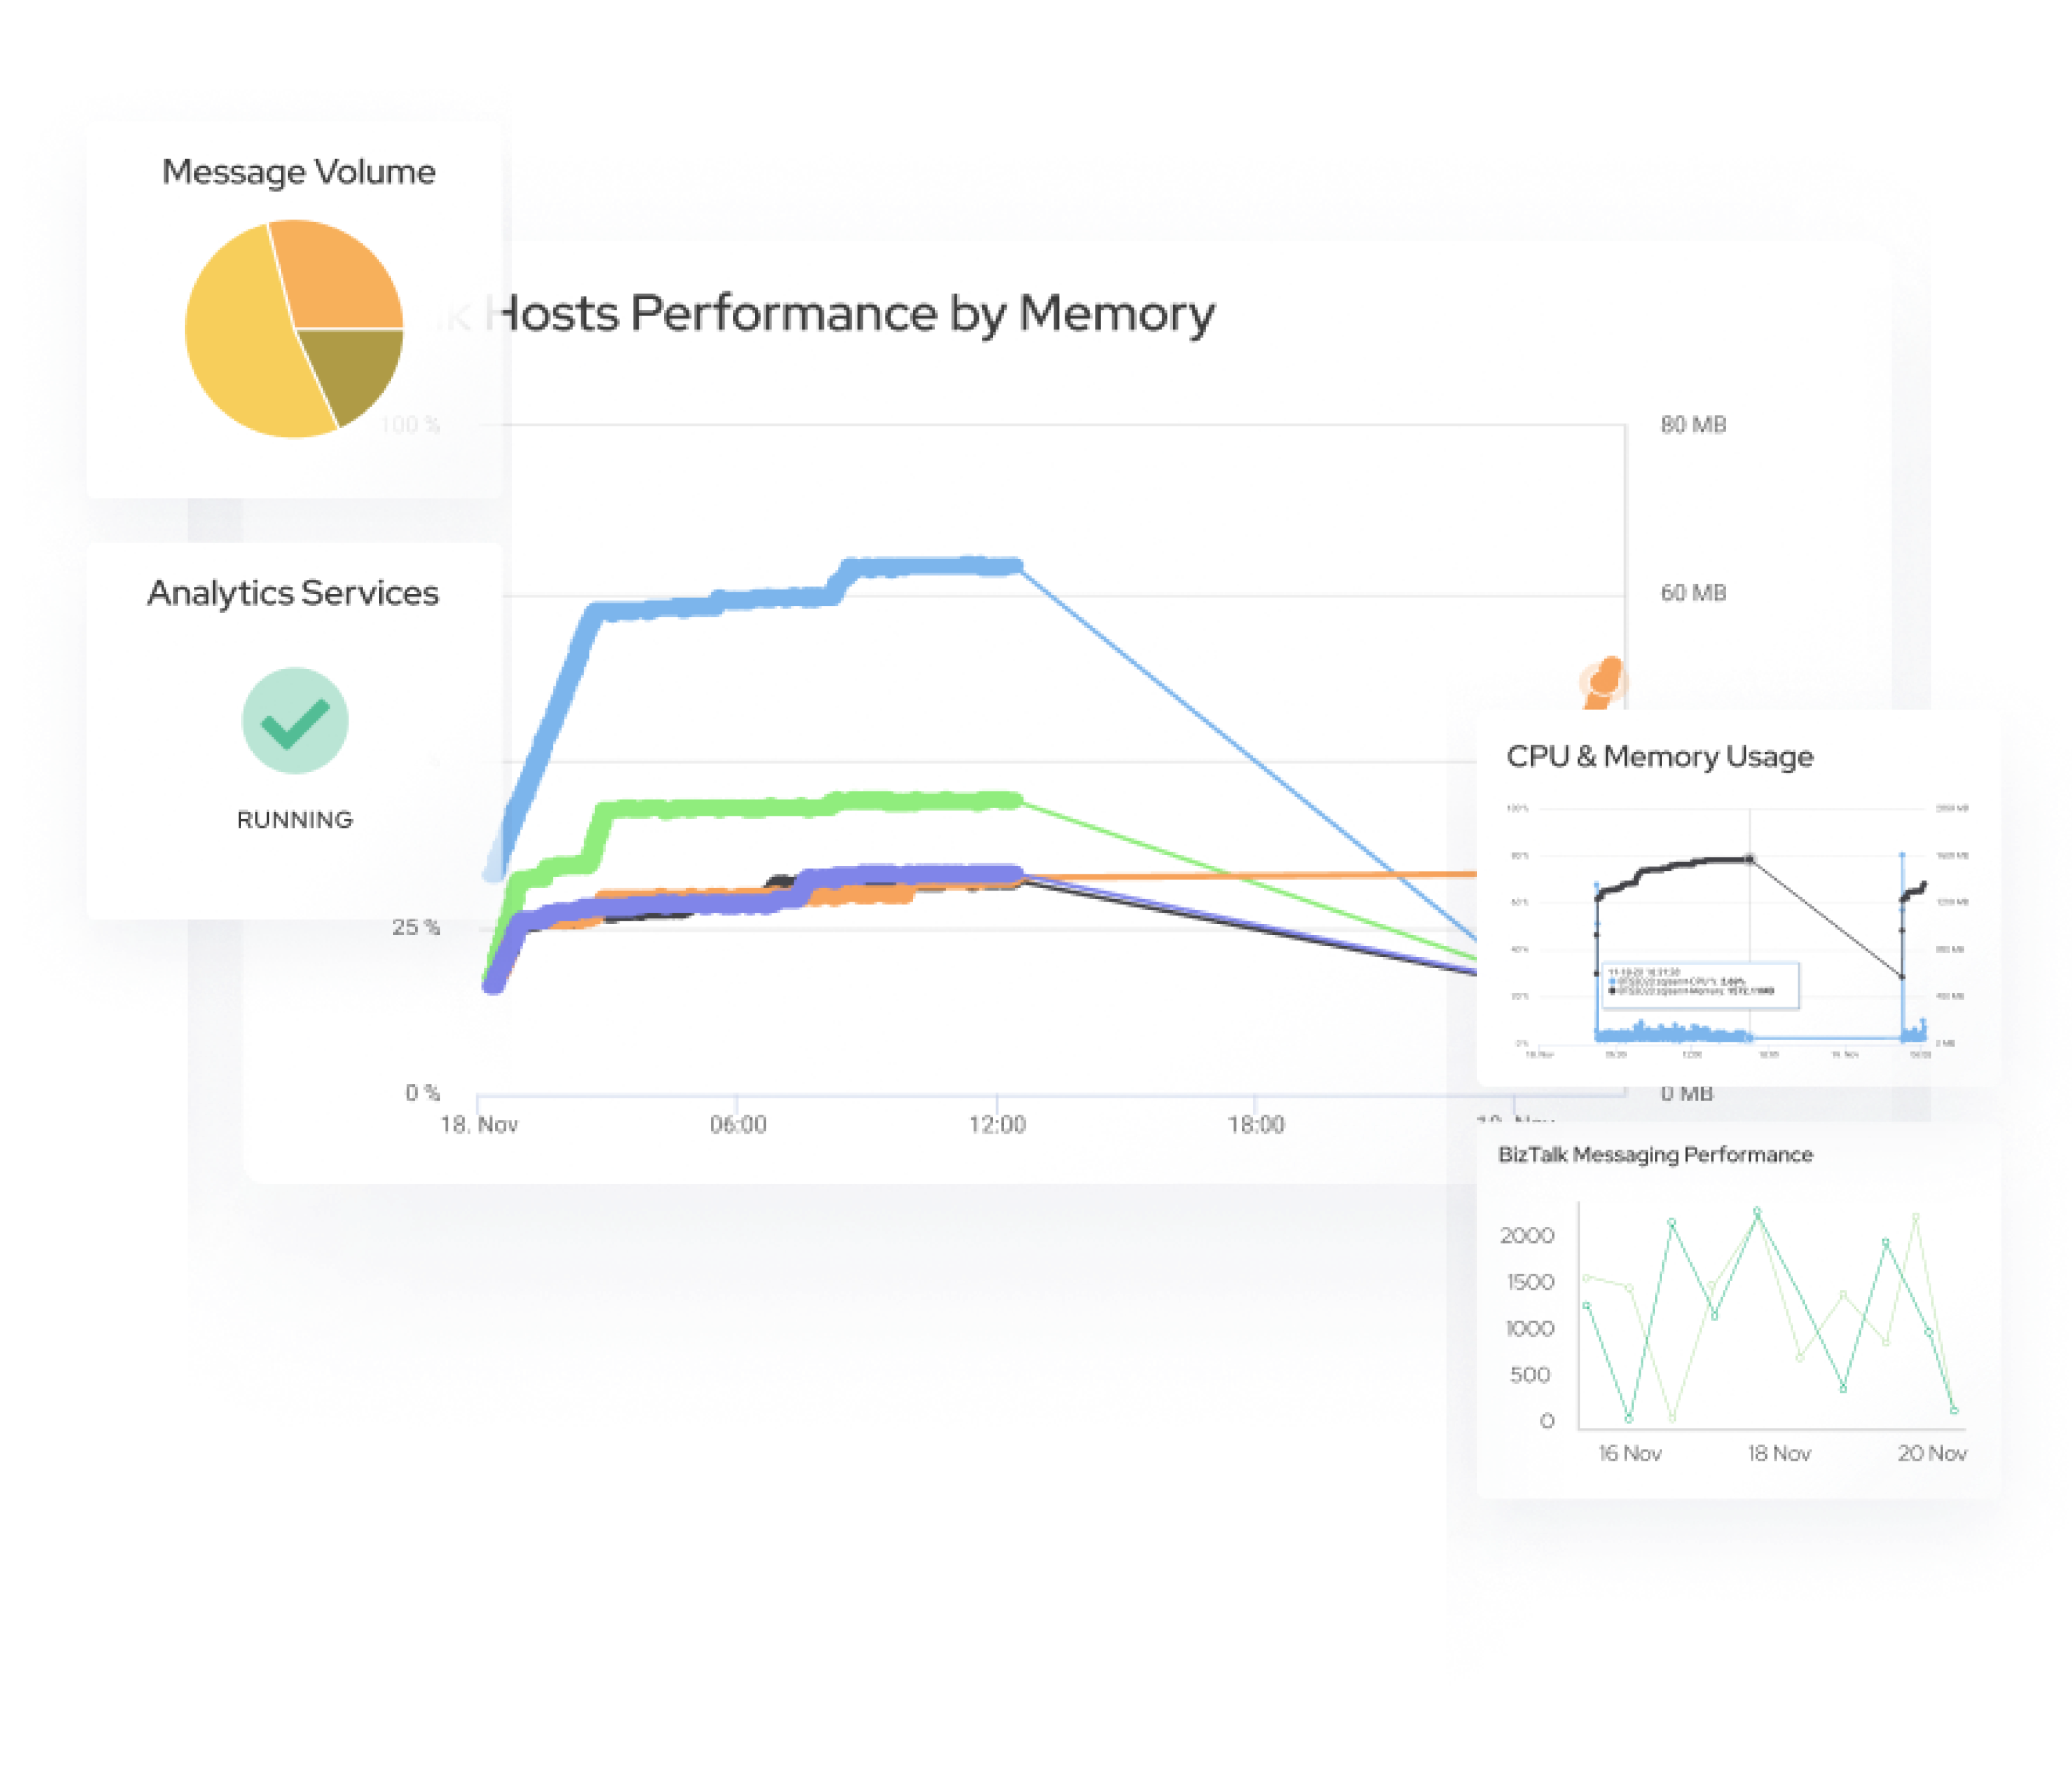
Performance Metrics: CPU utilization, memory usage, disk I/O, network traffic. Health Metrics: Instance status (running, stopped, terminated), uptime, availability. Cost Metrics: Monitoring costs associated with instances to optimize spending.
Collecting all the instance logs to Verify the user useage.
Set up alerts based on predefined thresholds for metrics like CPU, memory, and disk usage. Utilize integrations with notification channels such as email, Slack, or SMS to notify teams about critical issues.
Monitor security-related metrics such as access logs, authentication attempts, and firewall rules. Implement intrusion detection systems (IDS) and vulnerability assessments to enhance security posture.
Regularly review and optimize monitoring configurations to align with changing business needs and cloud environment dynamics. Analyze monitoring data to identify performance bottlenecks, optimize resource allocation, and improve cost efficiency.

Performance Metrics: CPU utilization, memory usage, disk I/O, network traffic, load average. System Health: Server uptime, availability, response times. Resource Utilization: Disk space usage, file system health, swap space utilization.
Monitor logs for errors, warnings, and security events to proactively address issues.
Implement security-specific monitoring tools or features to detect unauthorized access attempts, malware infections, or anomalies in system behavior. Utilize intrusion detection/prevention systems (IDS/IPS) and log analysis for security incident response.
Ensure monitoring practices align with regulatory requirements and industry standards. Generate reports and audits to demonstrate compliance and track performance metrics over time.
Regularly review and refine monitoring configurations and alert thresholds to adapt to changing infrastructure and business requirements. Incorporate feedback from monitoring data into operational and strategic decision-making processes.

Set up alert rules based on predefined thresholds or conditions. Threshold-based alerts: Trigger when a metric exceeds or falls below a specified threshold (e.g., CPU > 90%).
Identify unusual patterns or deviations from normal behavior. Correlation alerts: Combine multiple metrics to detect complex issues (e.g., high CPU and low memory simultaneously).
Configure notification channels to deliver alerts to relevant stakeholders: Email: Direct notifications to email addresses. SMS: Send text messages for critical alerts.
Establish severity levels (e.g., critical, warning) for alerts to prioritize responses. Implement escalation policies to ensure alerts are addressed promptly: First-level response: Initial handling by on-call personnel or automated systems. Escalation: Transfer alerts to higher-level support if not resolved within a specified time.
Test alerting configurations to ensure alerts are triggered appropriately. Validate notification channels to confirm alerts reach intended recipients and are actionable.
Monitor alerting effectiveness over time and refine alert rules based on feedback and operational experience. Regularly review and update alert thresholds as system usage patterns and performance metrics evolve.


We will try and understand your system architecture & discuss details of what it will take for you to get 100% compliant.